

Hunters getting ready for fall hunting seasons may now consult the 2025 Hunting Outlook and Mast Survey, which provides details about the abundance of wild fruits and nuts produced by 18 species of trees and shrubs and the forecasted impacts of their availability to West Virginia’s wildlife.
About the Hunting Outlook and Mast Survey
The WVDNR, in conjunction with the West Virginia Division of Forestry, annually surveys the state to determine hunting outlook and relative abundance of soft and hard mast produced by trees and shrubs of importance to wildlife populations.
Mast surveys are completed at various locations covering all regions of West Virginia. Professionals and volunteer wildlife managers, foresters, wildlife biologists, Natural Resources Police Officers, Natural Resources Commissioners and retired personnel from a multitude of natural resources related disciplines devote their time and effort to collect data for these surveys.
How the Mast Index is Calculated
The mast survey is a relative estimation of mast produced by 18 different tree and shrub species that are widespread and locally common throughout the state and are of nutritional value to wildlife.
Cooperators are assigned counties and areas familiar to them to collect mast production information, and the same areas are generally surveyed each year to ensure consistency in the survey across years. Mast crop production is subjectively evaluated as abundant, common or scarce for each species encountered by the observer in the surveyed area. The surveyor also documents species that are not encountered, along with additional mast-producing species of local importance (e.g., Pawpaw, Persimmon, Cucumber-tree, Blueberry, Huckleberry, etc.) that do not appear on the statewide survey form. The mast index is calculated for each species, and in some cases guilds of species (e.g., hard mast producers, all oaks, oak-cherry-hickory, etc.), via the following formula:
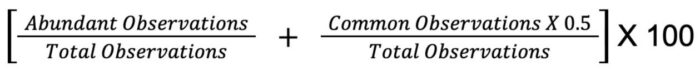
The mast index is calculated by species for each ecological region and elevation (high or low, relative to the local terrain of the surveyed county). The current year’s index is compared to the previous year’s index and the running long-term average spanning the life of the survey, which was first conducted in 1971.